We are all burdened with paying taxes, so many people tend to be in a bad mood when it is time to pay up. Even though we have a general idea of where our tax money goes, many of us don’t know what their tax money is really used for. So, let us take a closer look at the final destination of your tax money!
The Customized Tax Receipt Calculator
If you wish to know where your tax dollars are going, you could use a tool called a customised tax receipt calculator. This tool will show you exactly where your hard-earned money is going, so you can decide for yourself if the government is spending it wisely.
The Results of 2016
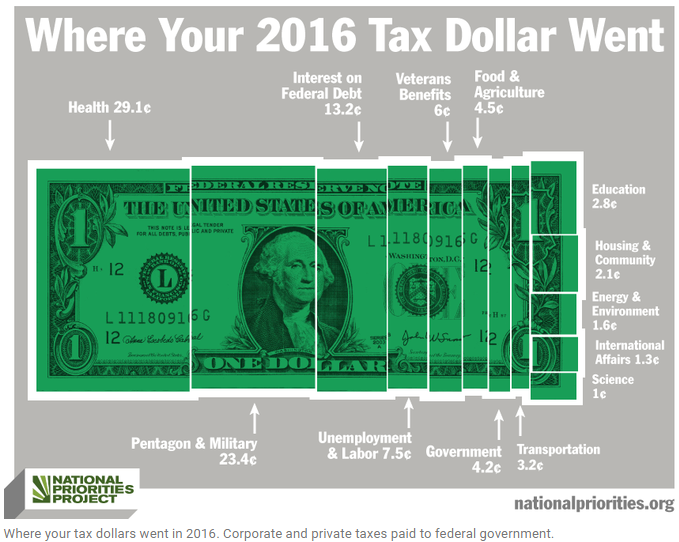
Based on the report of government spending of 2016, we can tell you where your tax dollars went last year. So, let us take a closer look to see if the government spent it wisely.
The largest chunk of tax dollars went to healthcare. The average taxpayer in the U.S. paid $14,051 in federal income tax and approximately $4,090 went to healthcare. The money was spent on special programs such as Medicaid, but also the Children’s Health Insurance Program.
After healthcare, the military took the largest chunk of your tax dollars last year, amounting to $3,290. Surprisingly, a lot less cash went to education and educational programs, which only received a meager $398.

Difference By State
We do need to mention that the government receives different amounts from each state, so the results stated before were based on the natural average. So, depending on the state you live, you could be contributing more or less than the average stated before.
In theory, those who make more money need to pay more taxes than those that do not. However, the practice is often different, because certain billionaires even pay less taxes than middle-class workers. Therefore, every American should have an equal say in how tax dollars are spent.
The residents of Connecticut were faced with the highest average in 2016, having to pay an annual $22,785 in federal taxes. The state that was least burdened last year was West Virginia, paying only $8,607 towards the national average.
Differences by state is not the only contributor to different government tax spending. Even though American residents are those who contribute the most, large companies are often those who determine where that money is spent, more specifically through lobbying and the tremendous power they have to fund a politician’s campaign. Considering that a company like General Electric and PG&E did not pay any federal income taxes despite making billions in profit, it does not seem like a fair distribution of decision power.
2016 Federal Income Tax Receipt
Average Federal Income Taxes Paid by State
April 15, 2017
Inflation adjusted to 2016 dollars
| Location | Average Taxes ▾ | Compared to National Average |
|---|---|---|
| United States | $14,051 | |
| Connecticut | $22,785 | +$8,734 |
| District of Columbia | $20,563 | +$6,512 |
| New York | $19,782 | +$5,731 |
| Massachusetts | $18,997 | +$4,946 |
| New Jersey | $18,367 | +$4,316 |
| California | $16,996 | +$2,945 |
| Wyoming | $16,329 | +$2,278 |
| Texas | $16,029 | +$1,978 |
| Illinois | $15,097 | +$1,046 |
| North Dakota | $14,823 | +$772 |
| Florida | $14,750 | +$699 |
| Washington | $14,664 | +$613 |
| Colorado | $14,244 | +$193 |
| Maryland | $14,239 | +$188 |
| Virginia | $14,197 | +$146 |
| New Hampshire | $13,110 | -$940 |
| Minnesota | $12,889 | -$1,161 |
| Nevada | $12,700 | -$1,350 |
| Pennsylvania | $12,605 | -$1,445 |
| Georgia | $12,471 | -$1,579 |
| Louisiana | $12,331 | -$1,719 |
| Alaska | $12,266 | -$1,784 |
| Kansas | $12,160 | -$1,890 |
| Rhode Island | $11,901 | -$2,149 |
| South Dakota | $11,842 | -$2,208 |
| Oklahoma | $11,744 | -$2,306 |
| Delaware | $11,290 | -$2,760 |
| Arizona | $11,264 | -$2,786 |
| Michigan | $11,252 | -$2,798 |
| Nebraska | $11,213 | -$2,837 |
| Tennessee | $11,192 | -$2,858 |
| North Carolina | $10,958 | -$3,092 |
| Utah | $10,953 | -$3,097 |
| Missouri | $10,874 | -$3,176 |
| Oregon | $10,715 | -$3,335 |
| Wisconsin | $10,618 | -$3,432 |
| Arkansas | $10,300 | -$3,750 |
| Ohio | $10,250 | -$3,800 |
| Alabama | $10,000 | -$4,050 |
| Iowa | $9,988 | -$4,062 |
| Montana | $9,964 | -$4,086 |
| Indiana | $9,930 | -$4,120 |
| Hawaii | $9,852 | -$4,198 |
| Vermont | $9,793 | -$4,257 |
| New Mexico | $9,630 | -$4,420 |
| South Carolina | $9,619 | -$4,431 |
| Idaho | $9,362 | -$4,688 |
| Kentucky | $9,195 | -$4,855 |
| Mississippi | $8,747 | -$5,303 |
| Maine | $8,630 | -$5,420 |
| West Virginia | $8,607 | -$5,443 |
Conclusion
Since American taxpayers provide the most funds for health, education, the military and other departments vital to our society, they should be the ones who decide what their money is spent on. It is time to take an honest look at the power of corporations within America, and determine if their opinion is truly best for the actual tax payer.
Considering very little of our tax money went to education in 2016, one has to wonder why so little is invested in our children and their futures?