New York Has Heaviest Tax Burden in the Nation!

Uncle Sam regularly needs contributions from our paycheck, but the residents who seem to be giving the most are New Yorkers. With a tax burden determined on 12.94% of their income, the Tax Foundation Report proved that New York has the heaviest tax burden in the nation.
The Definition of Tax Burden
Before we start looking at numbers, let us take a closer look at what the numbers actually mean. For this, we need to explain the definition of the tax burden.
The tax burden cannot be confused with tax rate. The tax burden is a percentage used to indicate the proportion of a person’s income taken by the local government and the state, while tax rates are based on a person’s individual circumstances.
The Average Tax Burden
In 2012, the average tax burden across the United States was $4,420; this includes state and local taxes. However, when comparing this amount to the tax burden of New York, which amounts to $6,993, it seemed like New Yorkers are carrying a considerably heavier tax burden than the rest of the nation.
Still, New York’s neighbor states seem to be carrying a heavy tax burden themselves, since Connecticut and New Jersey ranked number 6th and 7th respectively on the overall list. Connecticut has a tax burden of 10.23 percent, while New Jersey has a tax burden of 10.14 percent.
The high percentages in New York, New Jersey and Connecticut are considerably different than those of the so-called low tax burden states; this includes Delaware at 5.59% and Alaska with 6.27% at the bottom of the list. (Data provided by Wallethub)
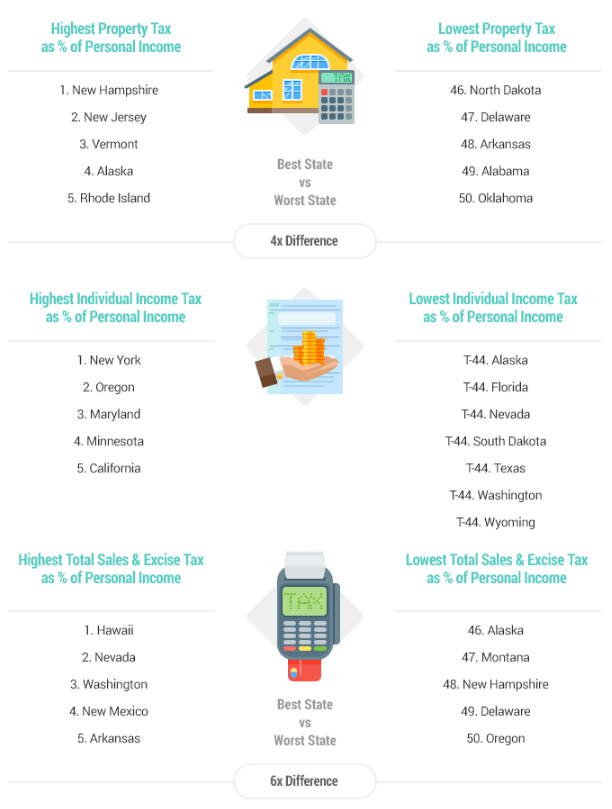
Overall Tax Burden by State
| Overall Rank | State | Total Tax Burden (%) |
Property Tax Burden (%) |
Individual Income Tax Burden (%) |
Total Sales & Excise Tax Burden (%) |
|---|---|---|---|---|---|
| 1 | New York | 12.94% | 4.55% | 4.76% | 3.63% |
| 2 | Hawaii | 11.27% | 2.11% | 2.64% | 6.52% |
| 3 | Vermont | 10.75% | 4.96% | 2.29% | 3.50% |
| 4 | Maine | 10.73% | 4.65% | 2.58% | 3.50% |
| 5 | Minnesota | 10.24% | 2.87% | 3.59% | 3.78% |
| 6 | Connecticut | 10.23% | 4.16% | 3.24% | 2.83% |
| 7 | New Jersey | 10.14% | 5.31% | 2.32% | 2.51% |
| 8 | Rhode Island | 10.09% | 4.80% | 2.15% | 3.14% |
| 9 | Illinois | 10.00% | 4.14% | 2.66% | 3.20% |
| 10 | California | 9.52% | 2.72% | 3.44% | 3.36% |
| 11 | Wisconsin | 9.44% | 3.73% | 2.66% | 3.05% |
| 12 | Maryland | 9.38% | 2.76% | 3.88% | 2.74% |
| 13 | Ohio | 9.15% | 2.85% | 2.66% | 3.64% |
| 14 | West Virginia | 9.13% | 2.38% | 2.68% | 4.07% |
| 15 | Arkansas | 9.12% | 1.79% | 2.33% | 5.00% |
| 16 | Nebraska | 9.07% | 3.64% | 2.33% | 3.10% |
| 17 | Mississippi | 9.02% | 2.68% | 1.63% | 4.71% |
| 18 | Massachusetts | 9.01% | 3.66% | 3.29% | 2.06% |
| 19 | Iowa | 8.96% | 3.43% | 2.40% | 3.13% |
| 20 | Kansas | 8.72% | 3.09% | 1.87% | 3.76% |
| 20 | New Mexico | 8.72% | 2.00% | 1.70% | 5.02% |
| 22 | Kentucky | 8.71% | 1.99% | 3.05% | 3.67% |
| 23 | Indiana | 8.63% | 2.40% | 2.26% | 3.97% |
| 24 | Pennsylvania | 8.52% | 2.93% | 2.54% | 3.05% |
| 25 | Utah | 8.51% | 2.57% | 2.61% | 3.33% |
| 26 | Michigan | 8.48% | 3.26% | 2.05% | 3.17% |
| 27 | Oregon | 8.40% | 3.24% | 4.02% | 1.14% |
| 28 | North Carolina | 8.33% | 2.42% | 2.66% | 3.25% |
| 29 | Louisiana | 8.29% | 2.01% | 1.42% | 4.86% |
| 30 | Nevada | 8.25% | 2.35% | 0.00% | 5.90% |
| 31 | Arizona | 8.22% | 2.59% | 1.35% | 4.28% |
| 32 | Georgia | 8.20% | 2.80% | 2.29% | 3.11% |
| 33 | Washington | 8.18% | 2.71% | 0.00% | 5.47% |
| 34 | Texas | 7.99% | 3.57% | 0.00% | 4.42% |
| 35 | Colorado | 7.97% | 2.74% | 2.12% | 3.11% |
| 36 | North Dakota | 7.93% | 1.94% | 1.16% | 4.83% |
| 37 | South Carolina | 7.82% | 2.93% | 1.92% | 2.97% |
| 38 | Missouri | 7.77% | 2.34% | 2.28% | 3.15% |
| 39 | Idaho | 7.75% | 2.50% | 2.20% | 3.05% |
| 40 | Virginia | 7.60% | 2.91% | 2.61% | 2.08% |
| 41 | Montana | 7.51% | 3.61% | 2.56% | 1.34% |
| 42 | Wyoming | 7.29% | 3.77% | 0.00% | 3.52% |
| 43 | Alabama | 7.19% | 1.41% | 1.85% | 3.93% |
| 44 | South Dakota | 7.12% | 2.83% | 0.00% | 4.29% |
| 45 | Florida | 6.79% | 2.76% | 0.00% | 4.03% |
| 46 | New Hampshire | 6.70% | 5.33% | 0.13% | 1.24% |
| 47 | Oklahoma | 6.61% | 1.38% | 1.69% | 3.54% |
| 48 | Tennessee | 6.45% | 2.06% | 0.09% | 4.30% |
| 49 | Alaska | 6.27% | 4.84% | 0.00% | 1.43% |
| 50 | Delaware | 5.59% | 1.83% | 2.59% | 1.17% |
Local Property Property Taxes to Blame
During a interview several years ago, Governor Cuomo stated that the high tax burden put on New York could be attributed to the high local property taxes. To resolve the issue, he proposed consolidating municipal governments, which could reduce costs and lower the local tax burden of New Yorkers.
Still, despite putting up $20 million in a proposal by Governor Andrew Cuomo a year ago in order to consolidate the municipal governments, no real changes have been seen in the tax burden of New York. Instead, the tax burden has increased by almost a full percent, totalling on 12.94 percent this year!
According to Wallethub, there is also a difference between the tax burden in Red States and Blue States. The Red States appear to have a lower overall tax burden than the Blue States, so the local governing body does seem to play a role where tax burden is concerned. When it comes to the next election, the tax burden could therefore play a role in the decision of voters.
Conclusion
The high tax burden in New York is not really surprising, but it is surprising that despite measures taken by the government the tax burden has increased dramatically over the past couple of years. Therefore, it is likely that New York will stay on top of the tax burden list for many years to come, unless the local and state governments can find a solution for high local property taxes and other tax-related problems that plague the state.